The Ultimate Guide to Understanding IoT Sensing: Everything You Need to Know

IoT sensing is a critical components of the Internet of Things (IoT) ecosystem. It is the process of capturing data from physical sensors, such as temperature, humidity, or light sensors, and transmitting that data to a central system for processing and analysis. IoT sensing is used in a variety of applications, from smart homes and buildings to industrial automation and healthcare. In digital assurance IoT testing plays a vital role so as the IoT sensing.

From IoT sensing to cloud

The IoT sensing architecture consists of three main components: sensors, gateways, and cloud platforms.

Sensors are physical devices that capture data from the environment. They can be wired or wireless and come in various forms, such as temperature sensors, humidity sensors, pressure sensors, and motion sensors. Sensors also can include cameras, microphones, and other types of sensors that capture data in different formats.

Gateways are the intermediate devices that receive data from sensors and transmit that data to a cloud platform for processing and analysis. Gateways can perform data filtering and aggregation, as well as provide security and connectivity to different types of networks.

Cloud platforms are the central systems that receive and process data from sensors and gateways. Cloud platforms can store data, run analytics, and provide dashboards and visualizations for end-users. Cloud platforms can also integrate with other systems, such as enterprise resource planning (ERP) or customer relationship management (CRM) systems

Here are a few examples of IoT sensing protocols

  • MQTT – One commonly used protocol for IoT sensing is the MQTT (Message Queuing Telemetry Transport) protocol. MQTT is a lightweight, publish-subscribe messaging protocol designed for IoT applications with low bandwidth, high latency, or unreliable networks.
  • CoAP – It can be used for IoT sensing CoAP (Constrained Application Protocol), which is designed for constrained devices and networks. CoAP uses a client-server model, where the client sends requests to the server and the server responds with data.

An example of using CoAP for IoT sensing could be in a smart agriculture system. Let’s say we have a soil moisture sensor in a field that sends data to an IoT platform using CoAP. The sensor would send a request to the CoAP server on the platform, asking for the current soil moisture level. The server would initially respond with the data, which the platform could use to determine if the crops need watering.

There are many other protocols that can be used for IoT sensing, including HTTP, WebSocket, and AMQP. The choice of protocol depends on the specific requirements of the application, such as the level of security needed, the amount of data being transmitted, and the network environment.

Also read: IoT Testing Approach on Devices

IoT Sensing Use Cases

IoT can be used in a variety of applications, such as Smart Homes and buildings, Industrial Automation and Healthcare.

  • In smart homes and buildings, IoT sensing can be used to control heating, lighting, and ventilation system based on environmental conditions. For example, a temperature sensor can be used to adjust the heating system based on the current temperature, while a light sensor can be used to adjust the lighting system based on the amount of natural light.
  • In healthcare, IoT sensing can be used to monitor patients and improve patient outcomes. For example, a wearable sensor can be used to monitor a patient’s heart rate and transmit that data to a cloud platform for analysis. The cloud platform can then alert healthcare professionals if the patient’s heart rate exceeds a certain threshold.

IoT Sensing and Predictive Maintenance

The Internet of Things (IoT) has revolutionized predictive maintenance by enabling real-time monitoring and analysis of equipment and systems. By deploying IoT sensors, organizations can collect data on various factors, including temperature, vibration, energy consumption, and more. This data is analyzed using machine learning algorithms to identify patterns and anomalies that can predict equipment failure.

Predictive maintenance in IoT sensing has numerous benefits, including

  • Reduced Downtime: By predicting equipment failures before they occur, maintenance can be scheduled during planned downtime, and reduce the impact on operations.
  • Lower Maintenance Costs: Predictive maintenance allows organizations to replace or repair equipment before it fails and reduce the need for emergency repairs and overall maintenance costs.
  • Increased Efficiency: By monitoring equipment in real-time, organizations can identify inefficiencies and optimize operations to reduce energy consumption and increase efficiency.
  • Improved Safety: Predictive maintenance can identify potential safety issues before they become a hazard, reducing the risk of accidents and injuries

For example, consider a fleet of trucks used for transporting goods. Each truck is equipped with IoT sensors that collect data on factors such as speed, fuel consumption, and engine performance. This data is analysed using predictive maintenance algorithms to identify when maintenance is required. For example, if the algorithm detects a decrease in fuel efficiency, it may predict that the engine needs to be serviced. The maintenance team can then schedule a service appointment before the engine fails, minimizing the risk of costly breakdowns and repairs.

Condition Monitoring and prognostics Algorithms

It is used in a variety of industries to evaluate the efficiency and state of machinery and systems. Condition monitoring is the process of keeping an eye on the health of machinery or other equipment to spot any changes that could indicate a potential problem. Prognostics, on the other hand, is the process of determining an equipment’s or system’s future health using the data gathered during condition monitoring.

Algorithms for condition monitoring and prognostics are generally required to maintain the effectiveness and functionality of equipment and systems. By utilising these algorithms, organisations can reduce the risk of equipment malfunction or damage, reduce downtime, and boost productivity.

Start your journey towards understanding IoT today!

Click here

Conclusion

IoT sensing, to sum up, is a rapidly expanding field that uses sensors and other smart devices to gather and transmit information about the physical world to the internet or other computing systems. Organisations and individuals can make better decisions and achieve better results by using the data collected by these sensors to provide insights into a variety of processes and environments

Data Wrangling 101 – A Practical Guide to Data Wrangling

Data wrangling plays a critical role in machine learning. It refers to the process of cleaning, transforming, and preparing raw data for analysis, with the goal of ensuring that the data used in a machine learning model is accurate, consistent, and error-free.

Data wrangling can be a time-consuming and labour-intensive process, but it is necessary for achieving reliable and accurate results. In this blog post, we’ll explore various techniques and tools that are commonly used in data wrangling to prepare data for machine learning models.

  1. Data integration: Data integration involves combining data from multiple sources to define a unified dataset. This may involve merging data from different databases, cleaning and transforming data from different sources, and removing irrelevant data. The goal of data integration is to create a comprehensive dataset that can be used to train machine learning models.
  2. Data visualization : Data visualization is the process of creating visual representations of the data. This may include scatter plots, histograms, and heat maps. The goal of data visualization is to provide insights into the data and identify patterns that can be used to improve machine learning models.
  3. Data cleaning: Data cleaning is the process of identifying and correcting errors, inconsistencies, and inaccuracies in the data. This step includes removing duplicate values, filling in missing values, correcting spelling errors, and removing duplicate rows. The objective of data cleaning is to ensure that the data is accurate, complete, and consistent.
  4. Data reduction: Data reduction is the process of reducing the amount of data used in a machine learning model. This may involve removing redundant data, removing irrelevant data, and sampling the data. The goal of data reduction is to reduce the computational requirements of the model and improve its accuracy.
  5. Data transformation: Data transformation involves converting the data into a format that is more suitable for analysis. This may include converting categorical data into numerical data, normalizing the data, and scaling the data. The goal of data transformation is to make the data more accessible for machine learning algorithms and to improve the accuracy of the models.        

Also check out this blog on Explainable Artificial Intelligence for a more ethical AI process.

Let’s look into some code:

Here we are taking a student performance dataset with the following features:

  1. gender
  2. parental level of education
  3. math score
  4. reading score
  5.  writing score

For data visualisation, you can use various tools such as Seaborn, Matplotlib, Grafana, Google Charts, and many others to visualise the data.

Let us demonstrate a simple histogram for a series of data using the NumPy library.

Pandas is a widely-used library for data analysis in Python, and it provides several built-in methods to perform exploratory data analysis on data frames. These methods can be used to gain insights about the data in the data frame. Some of the commonly used methods are:

df.descibe(), df.info(), df.mean() , df.quantile() , df.count()

(- df is pandas dataframe)

Let’s see df.descibe(), This method generates a statistical summary of the numerical columns in the data frame. It provides information such as count, mean, standard deviation, minimum, maximum, and percentile values.


For data cleaning, we can use the fillna() method from Pandas to fill in missing values in a data frame. This method replaces all NaN (Not a Number) values in the data frame with a specified value. We can choose the value to replace the NaN values with, either a single value or a value computed based on the data. 

For Data reduction we can do Sampling, Filtering, Aggregation, Data compression.

In the example below, we are removing the duplicate rows from the pandas drop_duplicates() method.

We will examine data normalisation and aggregation for data transformation; we are scaling the data to ensure that it has a consistent scale across all variables. Typical normalisation methods include z-score scaling and min-max scaling.

    Here, we’re using a StandardScaler to scale the data.  

Use the fillna () method in the Python pandas library to fill in missing or NaN (Not a Number) values in a Data Frame or a Series by using the mean value of the column.

Transform the categorical data in the ‘gender’ column into numerical data using one hot encoding. We will use get_dummies(), a method in the Pandas library of Python used to convert categorical variables into dummy or indicator variables.

Optimize your data for analysis and gain valuable insights with our advanced data wrangling services. Start streamlining your data processes today!

Click here


In conclusion, data wrangling is an essential step in the machine learning process. It involves cleaning, transforming, and preparing raw data for analysis to ensure that the data used in a machine learning model is accurate, consistent, and error-free. By utilising the techniques and tools discussed in this blog post, data scientists can prepare high-quality data sets that can be used to train accurate and reliable machine learning models.


Power BI Meta Data extraction using Python

In this blog we are going to learn about Power BI.pbit files, Power BI desktop file Meta data, Extraction of Power BI Meta data and saving it as an excel file using .pbit file and a simple Python code using libraries like Pandas, OS, Regex, JSON and dax_extract.

What is Power BI and .pbix files?

Power BI is a market leading business intelligence tool by Microsoft for Cleaning, Modifying and Visualizing raw data to come up with actionable insights. Power BI comes with its own data transformation engine called power query and a formula expression language called DAX (Data Analysis Expressions).

DAX gives power BI the ability to calculate new columns, dynamic measures, and tables inside Power Bi desktop.

By default, Power BI report files are saved with .pbix extension which is a renamed version of a ZIP file which contains multiple components, such as the visuals, report canvas, model metadata, and data.

What is Power BI .pbit file

.pbit is a template file created by Power Bi desktop which is also a renamed version of a ZIP file that contains all the Meta data for the Power BI report but doesn’t contain the data itself. Once we extract .pbit file we get a DataModelSchema file along with other files which contain all the Meta data of a Power BI desktop files.

Later in this blog we will be using these .pbit and DataModelSchema files to extract Power BI desktop Meta data.

What is the Meta data in a Power BI Desktop file

Regarding what you see in the Report View in a Power BI desktop, meta data is everything. You can think of all the information as meta data, including the name, source, expression, data type, calculated tables, calculated columns, calculated measures, relationships and lineage between the model’s various tables, hierarchies, parameters, etc.

We will mainly concentrate on extracting Calculated Measures, Calculated Columns, and Relationships in this blog.

Extraction of Meta data using Python

Python was used to process and extract the JSON from the.pbit file and DataModelSchema. We first converted JSON to a Python dictionary before extracting the necessary Meta data.

Below are the steps we will need to achieve the requirement:


1. Exporting .pbix file as .pbit file

There are two ways to save our power BI desktop file as .pbit file.

  • Once we are in Power BI desktop, we have an option to save our file as power BI template(.pbit) file
  • We can go to File–>Export–>Power BI Template and save the .pbit file at the desired directory.

2. Unzipping .pbit file to get DataModelSchema file

We can directly unzip the .pbit file using the 7z-Zip file manager or any other file manager. Once we Unzip the file, we will get a folder with the same name as that of the .pbit file. Inside the folder we will get the DataModelSchema file, we will have to change its extension to .txt for reading in python.

3. Reading .pbit and Data model schema file in python

We have an option to directly read the .pbit file in python using the dax_extract library. Second option to read the text file in python and using the JSON module convert it into a Python dictionary. Code can be found in the GitHub repository link given at the end of this file.

4. Extracting Measures from the dictionary

The dictionary that we get consists details of all the tables as separate lists, Individuals tables have details related to the columns and measures belonging to that table, we can loop on each table one by one and get details of columns, Measures etc. Below is an example of the Python code can be found in the GitHub Repository link given at the end of this file.

  table Number table Name Measure Name Measure Expression
0 5 Query Data % Query Resolved CALCULATE(COUNT(‘Query Data'[Client ID]),’Quer…
1 5 Query Data Special Query Percentage CALCULATE(COUNT(‘Query Data'[Client ID]),’Quer…
2 6 Asset Data Client Retention Rate CALCULATE(COUNT(‘Asset Data'[Client ID]),’Asse…


5. Extracting calculated columns from the Dictionary

Like how we extracted the measures we can loop on each table and get details of all the calculated columns. Below is the sample output of the Python code can be found in the GitHub Repository link given at the end of this file.


  table no Table Name name expression
6 2 Calendar Day DAY(‘Calendar'[Date])
7 2 Calendar Month MONTH(‘Calendar'[Date])
8 2 Calendar Quarter CONCATENATE(“Q”,QUARTER(‘Calendar'[Date]) )
9 2 Calendar Year YEAR(‘Calendar'[Date])


Also Read:  Certainty in streaming real-time ETL

6. Extracting relationships from the dictionary

Data for relationships is available in the model key of the data dictionary and can be easily extracted. Below is the sample output of the Python code can be found in the GitHub Repository link given at the end of this file. 


  From Table From Column To Table To Column State
0 Operational Data Refresh Date LocalDateTable_50948e70-816c-4122-bb48-2a2e442… Date ready
1 Operational Data Client ID Client Data Client ID ready
2 Query Data Query Date Calendar Date ready
3 Asset Data Client ID Client Data Client ID ready
4 Asset Data Contract Maturity Date LocalDateTable_d625a62f-98f2-4794-80e3-4d14736… Date ready
5 Asset Data Enrol Date Calendar Date ready


7. Saving Extracted data as an Excel file

All the extracted data can be saved in empty lists and these lists can be used to derive a Pandas data frame. This Pandas data frame can be exported as Excel and easily used for reference and validation purposes in a complex model. Below snapshot gives an idea of how this can be done.

Do you want to know more about Power BI meta data using Python? Then reach out to our experts today.

Click here

Conclusion

In this blog we learnt about extracting metadata from .pbit and DataModelSchema file. We have created a Python script that allows users to enter the file location of .pbit and DataModelSchema file and then metadata extraction along with excel generation can be automated. The code can be found on the below GitHub also sample excel files can be downloaded from below GitHub link. Hope this is helpful and will see you soon with another interesting topic.


Enabling intercommunication of distributed Google Virtual Machines via a secured private network

Introduction

In today’s digital age, businesses rely heavily on cloud computing infrastructure to enable efficient and scalable operations. Google Cloud Platform offers a powerful set of tools to manage and deploy virtual machines (VMs) across a distributed network. However, ensuring the security and seamless intercommunication of these VMs can be challenging. In this article, we will explore how to enable intercommunication of distributed Google Virtual Machines via a secured private network, providing a solution to this problem.

Let’s take a closer look at the current situation. One of our clients requested multitenant support for their newly launched application(s), which enables all of their customers’ sentiments to be converted from text to speech, for their end users. The real difficulty lay in connecting the various services found in various VPCs while providing multitenant support for the customers who were spread out geographically. At first, we thought VPC peering might be the best way to connect multiple VPC that are in different regions, but we later discovered the main challenges with the peering, which are:

  1. No overlap IPs accepted.
  2. Limitation per project which is maximum 50 peering can be done in a single project, but the client holds more than 70+ customers in their production project.

After researching, we identified Private Service Connect (PSC)is the enabler, for a quicker solution. The same has been communicated to the Client Team and the solution has been implemented in the Client Environment.

The illustration below demonstrates how Private Service Connect routes traffic to managed services, such as Google APIs and published services, by allowing traffic to endpoints and backends.

Introduction to Google Private Service Connect

Google Cloud networking provides Private Service Connect, which enables users to access manage services privately within their VPC network. Moreover, this feature enables managed service providers to host these services in their individual VPC and provide private connection to their users.

By this way the users can access the services using their internal IP addresses, eliminating the need to leave their VPC networks or use external IP addresses where all the traffic remains within Google Cloud granting precise control over the way services are accessed.
Managed services of various types are supported by Private Service Connect, including the following:

  • Published VPC-hosted services, which comprises the following:
    • GKE control plane by Google
    • Third-party published services like Databricks, Snowflake are made available through Private Service Connect partners.
    • Intra-organization published services, which enables two separate VPC networks within the same company to act as consumer and producer respectively
  • Google APIs, like Cloud Storage or Big Query are also included.

Features

Private Service Connect facilitates Private connectivity has salient features, such as:

  • The Private Service Connect is made to be service-oriented; the producer services are made available to the public through load balancers that only reveal one IP address to the consumer VPC network. By using this method, consumer traffic to producer services is assured to be one-way and limited to the service IP address, rather than gaining access to the entire peered VPC network.
  • Provides a precise authorization model that allows producers and consumers to exercise fine-grained control. Due to the guarantee that only the intended service endpoints can connect to the service, any unauthorised access to resources is prevented.
  • Between consumer and producer VPC networks, there are no shared dependencies. There is no need for IP address coordination or any other shared resource dependencies because NAT is used to facilitate traffic between them. Because of their independence, managed services can be deployed quickly and scaled as needed.
  • Enhanced performance and bandwidth by directing traffic from consumer clients to producer backends directly, without any intermediary hops or proxies. The physical host machines that house the consumer and producer VMs are where NAT is directly configured. The bandwidth capacity of the client and server machines that are directly communicating sets a limit on the bandwidth available.

Also read:   How to Secure an AWS Environment with Multiple Accounts

Step by step guide

1. Create a new project- shared-resource-vpc to maintain Redis as centralized service across multiple projects

2. VPC Creation: A new VPC named lb-vpc created in the US-West region

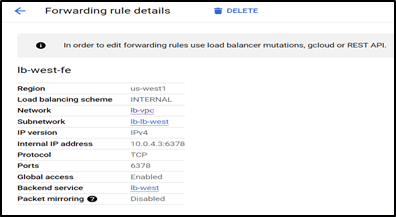
For instance, assuming all the customers of the client use the default IP range of 10.0.3.0/24. To avoid an overlapping ip, created a new subnet (lb-lb-west) with the range 10.0.4.0/24 in the shared-resource-vpc project. The subnet is created in the US-West region assuming all the VM in the project is present in the West region, this is because Private service connect only allows inter-region connections, whereas VPC peering allows multi- region connection.

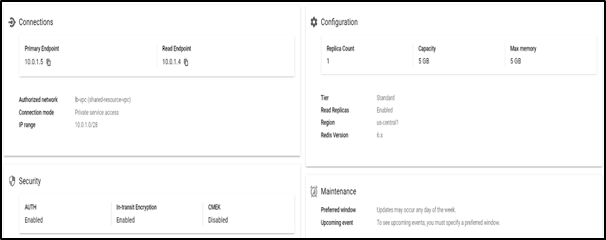
3. Redis is created in the Standard mode under the shared-resource-VPC project using the lb-vpc along with securities like Auth and TLS enabled.

4. A new VM is created in the shared-resource-VPC project, and installed HA Proxy to route traffic of the Redis machine

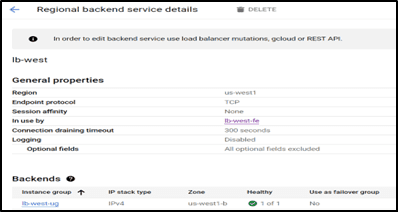
5. Internal Load balancer is used to manage the service connection across the project, new TCP LB created in the Shared-resource-VPC project named lb-west.


Configured the backend with 6378 ports enabled to communicate with the proxy machine and the frontend machine used to forward the rule with an Ip.


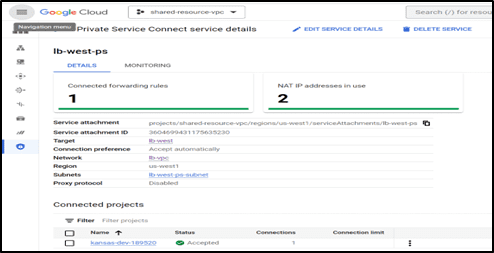
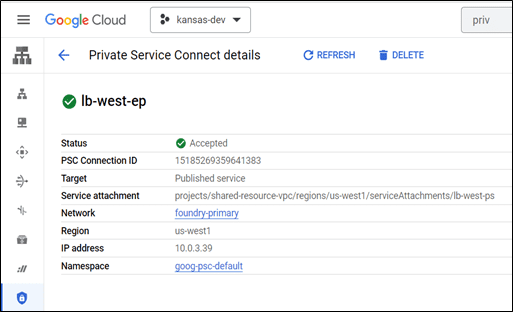
6. Private service Connect is used to configure the Publisher and the receiver connection, in our case the publisher is the shared-resource-VPC and the receiver is the Kansas-dev-18950 project.

After creating the private service connect in the publisher machine the service Attachment ID has to be used in the end point connection to establish the connection between the two projects.

7. Testing the connection from the foundry2 machine to Redis memory store present in the Kansas-dev project, we now use the private service endpoint to connect to the Redis machine along with TLS certificate attached in the foundry2 VM.

Benefits

PSC brings in a plethora of benefits to the customers who have heavy customer base at disparate locations.

  1. Seamless connectivity to businesses in distributed locations with a better user experience especially for SaaS application users
  2. Consumers can now access Google’s services directly over Googles backbone network which is more robust and has no latency.
  3. PSC insulates customer’s traffic from the public internet, creating a secured private network for transmitting any data without being decoded by intruders
  4. All services are now accessible via end points with private IP addresses, eliminating need for proxy servers
  5. Affordable pricing – VM to VM egress when both VMs are in different regions of the same network using internal or external IP addresses, costs less than a Cent (0.01 USD between US and Canada)

Are you still not sure on how to Secure your distributed Google Virtual Machines by enabling intercommunication via a private network? Contact us we are here to help you.

Click here

Conclusion

In conclusion, the secure intercommunication of distributed Google Virtual Machines via a private network is a crucial step in ensuring the efficient and scalable operation of cloud computing infrastructure. With the right tools and best practices in place, businesses can take advantage of the power of Google Cloud Platform while ensuring the security of their data and operations. By following the guidelines provided in this article, organizations can confidently deploy and manage their virtual machines across a distributed network, achieving seamless intercommunication and network security.


Data Masking: Need, Techniques and Best Practices

Introduction

More than ever, the human race is discovering, revolving, and revolving. The revolution in Artificial Intelligence Domain has brought the whole human species to a new Dawn of personalized services. With more people adapting to the Internet, demands of various services in different phases of life are increasing. Let’s consider the case of Covid Pandemic, the demons are still at war with. In the times of lockdown, to stay motivated we have used Audio Book applications, video broadcasting applications, attended online exercise, Yoga, even Consulted with Doctors through an Application. While the physical streets were closed, there was more traffic online.

All these applications, websites, which we have used, have a simple goal and that is a better service to the user. To do so, they collect personal information directly or indirectly, intentionally or for the sake of betterment. The machines, despite their size starting from laptops to smart watches, even voice assistants are listening to us, watching us every move we made, every word we uttered. Albeit their purpose of doing so is noble, but there’s no guarantee of leakage-proof, intruder-proof and spammers-proof data handling. According to a study by Forbes, on average there are 2.5 quintillion bytes of data generated per day, and this data is increasing year by year exponentially. Data Mining, Data Ingestion and Migration phases are the most vulnerable phases for potential data leakage. The surprising news is the cyber-attacks also happen at a rate of 18 attacks per minute. More than 16 lakh cybercrimes happened in last 3 years in India only.


Need of Data Masking

Besides the online scams and frauds Cyber Attacks, data breaches are major risks to every organization that mines personal data. A data breach is where the attacker gains access to millions to billions of people’s personal information like bank details, mobile numbers, social service numbers, etc. According to the Identity Theft Resource Center (ITRC), 83% of the 1,862 data breaches in 2021 involved sensitive data. These incidents are now considered as equipment of modern warfare.

Data Security Standards

Based on the countries and regulatory authorities there are different rules that need to be imposed to protect sensitive information. European Union States promotes General Data Protection Regulation (GDPR) to protect personal and racial information along with digital information, Health records, biometric and genetic data of individuals. United States Department of Health and Human Service (HHS) passed Health Insurance Portability and Accountability Act that protects and promotes security standards for Privacy of Individually Identifiable Health Information. International Organization for Standardization and the International Electrotechnical Commission’s (IOS/IEC) 27001 and 27018 security standards promote confidentiality, integrity and availability norms for Big Data organizations. In Extract Transform and Load (ETL) services, Data Pipeline services or Data Analytics services sticking to these security norms are crucial and liberating.

Different Security Standards

Read this insightful blog post onMaximizing AI and ML Performance: A Guide to Effective Data Collection, Storage, and Analysis

Techniques to Protect Sensitive Data

All the security protocols and standards can be summarized into three different techniques: Data De-Identification, Data Encoding and Data Masking. Data De-identification is used to protect sensitive data by removing or obscuring identifiable information. In De-identification technique the original sensitive information will be anonymized i.e., to completely remove those records from database, pseudonymization i.e., to replace the sensitive information with aliases, and lastly the aggregation where data will be grouped and summarized and then will be presented or shared rather than sharing the original elements.

In de-identification the original data format or structure may not be retained. Data Encoding refers to the technique of encoding the data in cyphers which can later be decoded by authorized users. Various encoding techniques are Encryption – key based encryption of data, Hashing – Original data will be converted to hash values using Message Digest (md5), Secure Hash Algorithm (sha1) or BLAKE hashing, etc. In other hand Data masking is the technique of replacing the original data with factious or obfuscated data where the masked data retains the format and structure of original data. All these techniques do not fall into a particular class or follow a hierarchal trend. They are used alone with one another based on the use cases and the cruciality of the data.

Comparative abstraction of major techniques

Data Masking is of two types i.e., Static Data Masking (SDM) and Dynamic Data Masking (DDM). Static Data masking involves replacing sensitive data with realistic but fictitious data with the structure and format of original data. Static Data Masking involves substitution – replacing the sensitive data with fake data, Shuffling – Shuffle the data in a column to manipulate original value and its references, Nulling – Sensitive data will be replaced with Null values. Encryption – encryption of sensitive information, Redaction – partially masking the sensitive data where only one part of the data is visible. Whereas Dynamic Data Masking involves Full masking, partial masking – Mask portion, random masking – mask at random, conditional masking – mask when a specific condition is met, Encoding and Tokenization- convert data to non-sensitive token value that preserves the format and length of original data.

SDM masks data at rest by creating a copy of an existing data set. The copied and masked data can only be used to share in analysis and production teams. Updates to the original data do not reflect in masked data until a new copy is made whereas DDM masks data at query time. The updated data also comes in masked format because of the query. The liveness of data remains intact without worrying about data silos. SDM is the primary choice of data practitioners as it is reliable and completely isolated original data. In other hand, DDM depends on query time masking which poses a chance of failure at some adverse instances.

SDM vs DDM

Data Masking Best Practices

Masking of sensitive data depends on the use case of the resultant masked data. It is always recommended to mask the data in the non-production environment. However, there are some practices that need to be considered for secure and fault-tolerant data masking.

1. Governance: The organization must follow common security practices based on the country it’s operating in and the international data security standards as well.

2. Referential Integrity: Tables with masked data should follow references accordingly for the purpose of join while analyzing the data without revealing sensitive information.

3. Performance and Cost: Tokenization and Hashing often convert the data to a standard size which may be more than actual size. Masked data shouldn’t impact the general query processing time.

4. Scalability: In case of big data the masking technique should be able to mask large dataset and stream data as well.

5. Fault-tolerance: The technique should be tolerant to minimal data ugliness like extra space, comma, special characters etc. By scrutinizing the masking process and resultant data often helps to avoid common pitfalls.

Protect your sensitive data with proper data masking techniques. Contact us today to get in Touch.

Click here

Conclusion

In conclusion, the advancements in technology, particularly in the domain of Artificial Intelligence, have brought about a significant change in the way humans interact with services and each other. The COVID-19 pandemic has further accelerated the adoption of digital technologies as people were forced to stay indoors and seek personalized services online. The increased demand for online services during the pandemic has shown that technology can be leveraged to improve our lives and bring us closer to one another even in times of crisis. As we continue to navigate the post-pandemic world, the revolution in technology will play a significant role in shaping our future and enabling us to live a better life.


Accessibility Testing – ADA Compliance Testing

Introduction

Quality Assurance is essential for ensuring that digital products, including websites, apps, and software, are usable by all users, including those with disabilities. Testing for accessibility enables the detection of any obstacles that could prevent individuals with disabilities from using digital products. This article’s goal is to give a general overview of accessibility testing and explain why it’s crucial for producing accessible digital products

1. What is accessibility testing?

The process of assessing a digital product’s usability by those with impairments is known as accessibility testing. It involves examining a product’s usability and user interface using assistive technology like voice recognition software, keyboard-only navigation, and screen readers. A product’s compliance with accessibility standards like the Web Content Accessibility Guidelines (WCAG), and the Americans with Disabilities Act is also evaluated during accessibility testing ( ADA).

1.1. Web Content Accessibility Guidelines (WCAG)

Here are the Web Content Accessibility Guidelines (WCAG) according to the checkpoints and priority levels:

Level A

Describes the components of a web page that must be usable by people with physical disabilities for them to access the content at all.

Level AA

Contains elements on web pages that must be readable for a group of users to access the content.

Level AAA

Outlines web page components that can be made accessible so that the site can be used by the greatest number of people with disabilities.

1.2. Principles of WCAG

Here are a few common scenarios to validate the Data part:

Perceivable

All users, including those with disabilities, must be able to easily perceive and comprehend the content as it is presented. The provision of non-text content substitutes, such as pictures, videos, and audio, falls under this category.

Operable

The interface and navigation of the website must be operable for all users, including those who use assistive technologies such as screen readers or voice recognition software. This includes providing keyboard accessibility, clear and consistent navigation, and allowing enough time for users to interact with content.

Understandable

The content and interface must be presented in a way that is easy to understand for all users, including those with cognitive disabilities or who may have difficulty with language or reading. This includes using clear and simple language, providing context and structure, and avoiding jargon and overly complex terminology.

Robust

The content must be robust enough to work with a variety of user agents, including assistive technologies, and future technologies that may be developed. This includes using accessible markup and code, following standards and guidelines.

1.3. Assistive Technology

Assistive technology is a type of technology that is designed to assist people with disabilities in performing tasks that may be difficult or impossible without assistance. These technologies are designed to enhance accessibility, mobility, communication, and independence for people with physical disabilities.

Here are some examples of assistive technology:

Screen readers: These are software programs that can read text on a computer screen aloud for users who are visually impaired.

Wheelchairs: These are devices that enable people with mobility impairments to move around more easily.

Hearing aids: These are devices that amplify sound for people who are hard of hearing.

Braille displays: These are devices that convert digital text into Braille for users who are blind.

Voice recognition software: This technology allows users to control their computer or mobile device using their voice.

Rosthetic limbs: These are devices that replace missing or amputated limbs and help users do their everyday tasks.

Augmentative and alternative communication (AAC) devices: These are devices that help people who have difficulty speaking to communicate using alternative methods, such as sign language, or text-to-speech software.

Electronic magnifiers: These are devices that magnify text or images for users with low vision.

Environmental control systems: These are devices that allow users to control appliances, lights, and other household items using their voice or other assistive technology.

Assistive listening devices: These are devices that help people with hearing impairments hear more clearly in specific environments, such as classrooms or theaters.

By giving people with physical disabilities more independence, access to information, and chances to actively participate in their quality of life

Also Read this interesting blog on Testing the Reality of Apps in Physical devices

2. Importance of Accessibility testing

The use of digital products by everyone, including those with disabilities, is ensured by accessibility testing. Digital products may not be accessible to users with disabilities if they undergone accessibility testing. For instance, a non-accessible website may not be usable with a screen reader, making it impossible for people who are blind to use the site. Additionally, visitors who are color blind may find it difficult to understand the text on the page if a non-accessible website lacks sufficient color contrast.

Another reason accessibility testing is crucial is that it can assist businesses in adhering to accessibility laws and regulations. According to the Americans with Disabilities Act ( ADA), businesses must offer people with disabilities equal access to their products and services. Like this, government agencies must comply with Section 508 of the Rehabilitation Act, which directs that their electronic and information technologies be accessible to people with physical disabilities. Organizations may be able to stay out of court and other legal problems by following these regulations.

3. Testing Approach

Accessibility testing can be performed manually or with the use of automated tools. Manual testing involves using assistive technologies such as screen readers, keyboard-only navigation, and voice recognition software to evaluate a product’s accessibility. Manual testing is time-consuming and requires a high level of expertise to identify accessibility issues.

Automation testing involves using tools that scan a product’s code and user interface to identify accessibility issues. Automated testing is faster than manual testing and can identify many accessibility issues quickly. However, automated testing has its limitations, as it cannot identify all accessibility issues, especially those related to user experience. In general, a combination of manual and automated testing is recommended to ensure that a digital product is fully accessible.

3.1. Accessibility Testing Tools

Accessibility testing tools are software programs that can help developers and testers ensure that their applications or websites are accessible to all users, including those with certain disabilities.

Here are some popular accessibility testing tools:


S.No Tools Functionality
1 WAVE A free browser extension that provides feedback on the accessibility of web content.
2 Axe An accessibility testing tool that can be used as a browser extension or as a command-line tool.
3 aXe Coconut A cloud-based accessibility testing tool that provides comprehensive reports on the accessibility of web content.
4 Accessibility Insights A suite of tools for testing the accessibility of web content, including a browser extension and a command-line tool.
5 Color Contrast Analyzer A tool that allows developers to check the color contrast of web content to ensure it is accessible for users with visual impairments.
6 NVDA A free screen reader for Windows that can be used to test the accessibility of web content.
7 VoiceOver A built-in screen reader for Mac that can be used to test the accessibility of web content.
8 JAWS A commercial screen reader for Windows that can be used to test the accessibility of web content.
9 Chrome DevTools A built-in browser tool that can be used to test the accessibility of web content.
10 Tenon A cloud-based accessibility testing tool that provides detailed reports on the accessibility of web content.


These are just a few of the many accessibility testing tools available. It’s important to choose the right tool for your needs and to regularly test your website or application for accessibility to ensure that all users can access your content.

Ensure your website or application is accessible to all. Contact us to schedule your ADA compliance testing today.

Click here

Conclusion

Accessibility testing is a critical process that ensures websites and digital platforms are accessible to individuals with disabilities. It is essential to comply with the Americans with Disabilities Act (ADA) to provide equal opportunities for everyone to access information and services online. Testing for ADA compliance helps to identify and fix accessibility barriers, ensuring that individuals with physical disabilities can use the digital platforms without encountering any difficulties. Furthermore, it enhances the user experience and improves the reputation of the organization. By conducting regular ADA compliance testing, organizations can ensure that their digital platforms are accessible to all, regardless of their disabilities.

Maximizing AI and ML Performance: A Guide to Effective Data Collection, Storage, and Analysis

Data is often referred to as the new oil of the 21st century. Because it is a valuable resource that powers the digital economy in a similar way that oil fueled the industrial economy of the 20th century. Like oil, data is a raw material that must be collected, refined, and analyzed to extract its value. Companies are collecting vast amounts of data from various sources, such as social media, internet searches, and connected devices. This data can then be used to gain insights into customer behavior, market trends, and operational efficiencies.

In addition, data is increasingly being used to power artificial intelligence (AI) and machine learning (ML) systems, which are driving innovation and transforming businesses across various industries. AI and ML systems require large amounts of high-quality data to train models, make predictions, and automate processes. As such, companies are investing heavily in data infrastructure and analytics capabilities to harness the power of data.

Data is also a highly valuable resource because it is not finite, meaning that it can be generated, shared, and reused without diminishing its value. This creates a virtuous cycle where the more data that is generated and analyzed, the more insights can be gained, leading to better decision-making, increased innovation, and new opportunities for growth. Thus, data has become a critical asset for businesses and governments alike, driving economic growth and shaping the digital landscape of the 21st century.

There are various data storage methods in data science, each with its own strengths and weaknesses. Some of the most common data storage methods include:

  • Relational databases: Relational databases are the most common method of storing structured data. They are based on the relational model, which organizes data into tables with rows and columns. Relational databases use SQL (Structured Query Language) for data retrieval and manipulation and are widely used in businesses and organizations of all sizes.
  • NoSQL databases: NoSQL databases are a family of databases that do not use the traditional relational model. Instead, they use other data models such as document, key-value, or graph-based models. NoSQL databases are ideal for storing unstructured or semi-structured data and are used in big data applications where scalability and flexibility are key.
  • Data warehouses: Data warehouses are specialized databases that are designed to support business intelligence and analytics applications. They are optimized for querying and analyzing large volumes of data and typically store data from multiple sources in a structured format.
  • Data lakes: Data lakes are a newer type of data storage method that is designed to store large volumes of raw, unstructured data. Data lakes can store a wide range of data types, from structured data to unstructured data such as text, images, and videos. They are often used in big data and machine learning applications.
  • Cloud-based storage: Cloud-based storage solutions, such as Amazon S3, Microsoft Azure, or Google Cloud Storage, offer scalable, secure, and cost-effective options for storing data. They are especially useful for businesses that need to store and access large volumes of data or have distributed teams that need access to the data.

To learn more about : How AI and ML models are assisting the retail sector in reimagining the consumer experience.

Data collection is an essential component of data science and there are various techniques used to collect data. Some of the most common data collection techniques include:

  • Surveys: Surveys involve collecting information from a sample of individuals through questionnaires or interviews. Surveys are useful for collecting large amounts of data quickly and can provide valuable insights into customer preferences, behavior, and opinions.
  • Experiments: Experiments involve manipulating one or more variables to measure the impact on the outcome. Experiments are useful for testing hypotheses and determining causality.
  • Observations: Observations involve collecting data by watching and recording behaviors, actions, or events. Observations can be useful for studying natural behavior in real-world settings.
  • Interviews: Interviews involve collecting data through one-on-one conversations with individuals. Interviews can provide in-depth insights into attitudes, beliefs, and motivations.
  • Focus groups: Focus groups involve collecting data from a group of individuals who participate in a discussion led by a moderator. Focus groups can provide valuable insights into customer preferences and opinions.
  • Social media monitoring: Social media monitoring involves collecting data from social media platforms such as Twitter, Facebook, or LinkedIn. Social media monitoring can provide insights into customer sentiment and preferences.
  • Web scraping: Web scraping involves collecting data from websites by extracting information from HTML pages. Web scraping can be useful for collecting large amounts of data quickly.

Data analysis is an essential part of data science and there are various techniques used to analyze data. Some of the top data analysis techniques in data science include:

  • Descriptive statistics: Descriptive statistics involve summarizing and describing data using measures such as mean, median, mode, variance, and standard deviation. Descriptive statistics provide a basic understanding of the data and can help identify patterns or trends.
  • Inferential statistics: Inferential statistics involve making inferences about a population based on a sample of data. Inferential statistics can be used to test hypotheses, estimate parameters, and make predictions.
  • Data visualization: Making charts, graphs, and other visual representations of data to better understand patterns and relationships is known as data visualization. Data visualization is helpful for expressing complex information and spotting trends or patterns that might not be immediately apparent from the data.
  • Machine learning: Machine learning involves using algorithms to learn patterns in data and make predictions or decisions based on those patterns. Machine learning is useful for applications such as image recognition, natural language processing, and recommendation systems.
  • Text analytics: Text analytics involves analyzing unstructured data such as text to identify patterns, sentiment, and topics. Text analytics is useful for applications such as customer feedback analysis, social media monitoring, and content analysis.
  • Time series analysis: Time series analysis involves analyzing data over time to identify trends, seasonality, and cycles. Time series analysis is useful for applications such as forecasting, trend analysis, and anomaly detection.

Use Cases

To illustrate the importance of data in AI and ML, let’s consider a few use cases:

  • Predictive Maintenance: In manufacturing, AI and ML can be used to predict when machines are likely to fail, enabling organizations to perform maintenance before a breakdown occurs. To achieve this, the algorithms require vast amounts of data from sensors and other sources to learn patterns that indicate when maintenance is necessary.
  • Fraud Detection: AI and ML can also be used to detect fraud in financial transactions. This requires large amounts of data on past transactions to train algorithms to identify patterns that indicate fraudulent behavior.
  • Personalization: In e-commerce, AI and ML can be used to personalize recommendations and marketing messages to individual customers. This requires data on past purchases, browsing history, and other customer behaviors to train algorithms to make accurate predictions.

Real-Time Analysis

To achieve optimal results in AI and ML applications, data must be analyzed in real-time. This means that organizations must have the infrastructure and tools necessary to process large volumes of data quickly and accurately. Real-time analysis also requires the ability to detect and respond to anomalies or unexpected events, which can impact the accuracy of the algorithms.

Wrapping Up

In conclusion, data is an essential component of artificial intelligence (AI) and machine learning (ML) applications. Collecting, storing, and analyzing data effectively is crucial to maximizing the performance of AI and ML systems and obtaining optimal results. Data visualization, machine learning, time series analysis, and other data analysis techniques can be used to gain valuable insights from data and make data-driven decisions.

No matter where you are in your transformation journey, contact us and our specialists will help you make technology work for your organization.

Click here


Techno Functional QA – Moving towards Grey Box Testing

As organizations move toward digital transformation, Quality Assurance’s role becomes critical. To ensure the desired quality and functionality are achieved, black box testing is not sufficient. We should have a strong strategical approach to test the evolving technologies covering all the layers – front end, middle layer, and backend. To achieve this, we need a techno-functional approach to testing which is Grey-Box testing.

Grey box testing is a software testing technique that includes the elements of black box testing and white box testing. It involves testing a system or application with partial knowledge of its internal workings. In other words, the tester has some knowledge of the software’s internal structure, but not the complete knowledge that a white box tester has. This makes grey-box testing a more realistic and efficient approach to testing than black-box testing, while still providing some of the benefits of white-box testing.

You can use a technique called “grey box testing” to troubleshoot the software and identify its weaknesses. It can be used as an objective, non-obstructive form of penetration testing. In this kind of testing, the focus is on an application’s internal workings rather than how those workings interact with one another.

Outcome-based grey box testing

Efficient Testing: Grey box testing allows testers to focus their efforts on specific areas of the system that are likely to have defects, which helps to reduce testing time and costs.

Realistic Testing: Unlike black box testing, grey box testing provides insight into the system’s internal workings, making it more realistic and closer to how end-user interact with the software.

Comprehensive Testing: Grey box testing allows testers to access the system’s front-end and back-end, which helps identify defects that may be missed in black box testing.

Better Test Coverage: With access to some of the system’s internal workings, grey box testing can help identify more comprehensive test cases, leading to better test coverage.

Improved Quality: By identifying defects that may be missed in black box testing, grey box testing can help improve the overall quality of the software.

The Process

In grey box testing, test cases are generated based on algorithms that assess internal states, application architecture knowledge, and programme behavior rather than by testers having to design test cases from scratch.

 Steps to follow, while performing Grey Box testing:

  • Identifying and choosing Inputs from white and black box testing approaches.
  • Identify possible outputs from these inputs.
  • Identify key paths for the testing level.
  • Identify sub-functions for deep-level analysis.
  • Identify responses for sub-functions.
  • Detect probable outputs from sub-functions.
  • Perform sub-function test cases.
  • Assess and verify results.

Also read:  IoT Testing Challenges and Solutions: Overcoming the Unique Obstacles of IoT Testing.

Layers of Grey box

Grey box testing involves examining each layer with greater depth.

Database Testing: During grey box testing of a database application, the tester may have access to the database schema but not the source code. As a result, they can more effectively and realistically test the database’s features.

API Testing: In API testing, a tester may have knowledge of the API’s internal structure and data flow, but not the complete code. This allows them to identify any issues in the API functions or data handling.

Security Testing: In security testing, a tester may know the system architecture and security protocols but not have entire knowledge of the source code. This helps them to identify any security vulnerabilities that may be missed in black box testing.

Performance Testing: The tester may know the system architecture and data flow, which allows them to identify any bottleneck or performance issues in the system.

Discover the benefits of Grey Box testing for your software quality. Contact us to learn

Click here

Inference

By reducing bugs at an earlier stage of the life cycle, grey box testing can help to improve quality by identifying defects in all the layers.

It offers some insights into how the system functions internally, making it more realistic and thorough. The transition to Grey Box testing is inevitable given how quickly digital technologies are developing. Higher quality and less expensive results will result from moving left and towards the earlier testing phase.

6 Best Practices to Design a SuperApp for your Enterprise

Yandex Go started as Yandex, a taxi app, and now delivers more in its new avatar, like packages, documents, groceries, and food from restaurants and cafes. This is just one example of how a specialist app has expanded its service offerings to provide customers with convenience and ease in performing multiple actions on one platform. Rappi is another example of a very popular app in Latin America. It offers a range of services, from booking an e-scooter, to making payments, P2P transfers, buying tickets to movies and concerts, listening to songs, picking up packages, and even walking your dog!

Such apps that offer multiple mini services under one platform are called SuperApps. Gartner equates SuperApps to a Swiss army knife, the demand for which is being driven by youth who require powerful and easy-to-use mobile-first experiences. It also expects 50% of the global population to opt for SuperApps by 2027. Quick to tap into this trend are ‘forward-thinking organizations’ that create composable application and architecture strategies to capitalize on new business opportunities in relevant and related markets.

Key features of the SuperApp are:

  • They offer core features and enhance personalization by delivering a variety of mini apps such as messaging and payments.
  • They consolidate services, features, and functions from a variety of mobile apps into a single app to enable customers to use it for multiple operations.
  • They improve customer experience and ease of use with features like single sign-on (SSO), data sharing, app usage tracking, and preference-based push notifications.
  • They are poised to support other services like Internet of Things (IoT) technologies, chatbots, and metaverse for an immersive experience.
  • They help in achieving economies of scale, improving user experience, leveraging a large user base, and engaging different mini app teams effectively.

Super App Development – Best Practices

While consolidating multiple apps on a single app platform provides several benefits to the users, the development of such an app brings with it, its own challenges. Therefore, the right strategy, resources, and implementation become key.

The 5 Best Practices for the development of super apps include

Best Practice #1 Focus on Core Offering

Yandex started as a taxi app and then expanded. Identify the core service offering, ensure the supply side economy to build customer loyalty and trust, and constantly improve customer experience with that service through feedback and enhanced customer service. Create a list of key features and prioritize them based on customer requirements. Identify features that can differentiate your app from the rest in this space. In addition to the features relevant to the core features, include some must-haves like integration with Google and social, payment systems, and multi-language support, especially if the user base will go beyond boundaries.

Best Practice #2 Expand and Simplify

Once you have a substantial user base, expand your service offerings. Your users should be able to perform activities easily and have a seamless experience between the different features available. For instance, users should be able to leverage promotions, make payments, or cancel without exiting the app.

Best Practice #3 Collaborate to Grow

A single company cannot build for providing comprehensive services around the core offering. Therefore, forge partnerships with other suppliers to provide a unified experience and add value. Ensure the apps are credible and robust so that there is no compromise in user experience.

Best Practice #4 Select the Right Platform

The choice of platform will depend on the target audience. If the product is a niche, to be used by an identifiable, limited set of people, a single platform may be effective. But where the reach is wider with a variety of apps, you could choose between a single platform, multiple platforms, or a mobile-optimized website. Factors such as the availability of resources and budget will influence these decisions.

Best Practice #5 Elucidate Your Digital Business Model

How you plan to monetize your SuperApp is important to make the app sustainable and profitable. Since there are many mini apps, some from other vendors, having a clear strategy becomes critical. The app could provide some services free of charge to win customer trust and monetize the core functions. Another option could be to provide limited features for free and added functionalities for those who pay. The subscription model is the third option, and advertising revenues is the fourth option.

Best Practice #6 Build a Top-Notch Tech Stack

Robust tech stack along with a skilled development team is essential for building a feature-rich app and integrating multiple mini apps for a seamless performance. This spans the entire spectrum from the right cloud service such as Google Cloud, Azure, or AWS; technology suites such as HTML5 and CSS; programming and testing languages such as Python, Java, C#, Python; developer tools such as Redux, ReactJs, Ruby on Rails; testing frameworks such as Selenium; to other tools for marketing, management, analytics, and payment gateways. Security is another key aspect as data and finance are involved and any compromise can lead to erosion of customer trust, noncompliance, and loss of reputation.

Partner with Indium for Building a Killer SuperApp

Managing the development, testing, security, and integration aspects of SuperApps requires multiple skills. Building the tech stack and designing the architecture for scalability, flexibility, and robustness are critical.

Indium Software is a technology solution provider with cross-domain expertise and vast experience in developing cutting-edge solutions using best-of-breed technologies. We work closely with our customers to understand their core focus and design, develop, test, and deploy solutions that empower users to be more effective in meeting their goals.

Ready to elevate your enterprise’s app game? Let’s design a SuperApp together and take your business to the next level. Contact us today to get started.

Click here

FAQ

1. What is a key factor in making a SuperApp successful?

Consistent experience and seamless integration are critical for the success of a SuperApp.

Revolutionizing Data Warehousing: The Role of AI & NLP

In today’s quick-paced, real-time digital era, does the data warehouse still have a place?Absolutely! Despite the rapid advancements in technologies such as AI and NLP, data warehousing continues to play a crucial role in today’s fast-moving, real-time digital enterprise. Gone are the days of traditional data warehousing methods that relied solely on manual processes and limited capabilities. With the advent of AI and NLP, data warehousing has transformed into a dynamic, efficient, and intelligent ecosystem, empowering organizations to harness the full potential of their data and gain invaluable insights.

The integration of AI and NLP in data warehousing has opened new horizons for organizations, enabling them to unlock the hidden patterns, trends, and correlations within their data that were previously inaccessible. AI, with its cognitive computing capabilities, empowers data warehousing systems to learn from vast datasets, recognize complex patterns, and make predictions and recommendations with unprecedented accuracy. NLP, on the other hand, enables data warehousing systems to understand, analyze, and respond to human language, making it possible to derive insights from non-formatted data sources such as social media posts, customer reviews, and textual data.

The importance of AI and NLP in data warehousing cannot be overstated. These technologies are transforming the landscape of data warehousing in profound ways, offering organizations unparalleled opportunities to drive innovation, optimize operations, and gain a competitive edge in today’s data-driven business landscape.

Challenges Faced by C-Level Executives

Despite the immense potential of AI and NLP in data warehousing, C-level executives face unique challenges when it comes to implementing and leveraging these technologies. Some of the key challenges include:

  • Data Complexity: The sheer volume, variety, and velocity of data generated by organizations pose a significant challenge in terms of data complexity. AI and NLP technologies need to be able to handle diverse data types, formats, and sources, and transform them into actionable insights.
  • Data Quality and Accuracy: The accuracy and quality of data are critical to the success of AI and NLP in data warehousing. Ensuring data accuracy, consistency, and integrity across different data sources can be a daunting task, requiring robust data governance practices.
  • Talent and Skills Gap: Organizations face a shortage of skilled professionals who possess the expertise in AI and NLP, making it challenging to implement and manage these technologies effectively. C-level executives need to invest in building a skilled workforce to leverage the full potential of AI and NLP in data warehousing.
  • Ethical and Legal Considerations: The ethical and legal implications of using AI and NLP in data warehousing cannot be ignored. Organizations need to adhere to data privacy regulations, ensure transparency, and establish ethical guidelines for the use of AI and NLP to avoid potential risks and liabilities.

Also check out our Success Story on Product Categorization Using Machine Learning To Boost Conversion Rates.

The Current State of Data Warehousing

  • Increasing Data Complexity: In today’s data-driven world, organizations are grappling with vast amounts of data coming from various sources such as social media, IoT devices, and customer interactions. This has led to data warehousing becoming more complex and challenging to manage.
  • Manual Data Processing: Traditional data warehousing involves manual data processing, which is labor-intensive and time-consuming. Data analysts spend hours sifting through data, which can result in delays and increased chances of human error.
  • Limited Insights: Conventional data warehousing provides limited insights, as it relies on predefined queries and reports, making it difficult to discover hidden patterns and insights buried in the data.
  • Language Barriers: Data warehousing often faces language barriers, as data is generated in various languages, making it challenging to process and analyze non-English data.

The Future of Data Warehousing

  • Augmented Data Management: AI and NLP are transforming data warehousing with augmented data management capabilities, including automated data integration, data profiling, data quality assessment, and data governance.
  • Automation with AI & NLP: The future of data warehousing lies in leveraging the power of AI and NLP to automate data processing tasks. AI-powered algorithms can analyze data at scale, identify patterns, and provide real-time insights, reducing manual efforts and improving efficiency.
  • Enhanced Data Insights: With AI and NLP, organizations can gain deeper insights from their data. These technologies can analyze unstructured data, such as social media posts or customer reviews, to uncover valuable insights and hidden patterns that can inform decision-making.
  • Advanced Language Processing: NLP can overcome language barriers in data warehousing. It can process and analyze data in multiple languages, allowing organizations to tap into global markets and gain insights from multilingual data.
  • Predictive Analytics: AI and NLP can enable predictive analytics in data warehousing, helping organizations forecast future trends, identify potential risks, and make data-driven decisions proactively. Example: By using predictive analytics through AI and NLP, a retail organization can forecast the demand for a particular product during a particular time and adjust their inventory levels accordingly, reducing the risk of stock outs and improving customer satisfaction.

Discover how Indium Software is harnessing the power of AI & NLP for data warehousing.

Contact us

Conclusion

In conclusion, AI and NLP are reshaping the landscape of data warehousing, enabling automation, enhancing data insights, overcoming language barriers, and facilitating predictive analytics. Organizations that embrace these technologies will be better positioned to leverage their data for competitive advantage in the digital era. At Indium Software, we are committed to harnessing the power of AI and NLP to unlock new possibilities in data warehousing and help businesses thrive in the data-driven world.